


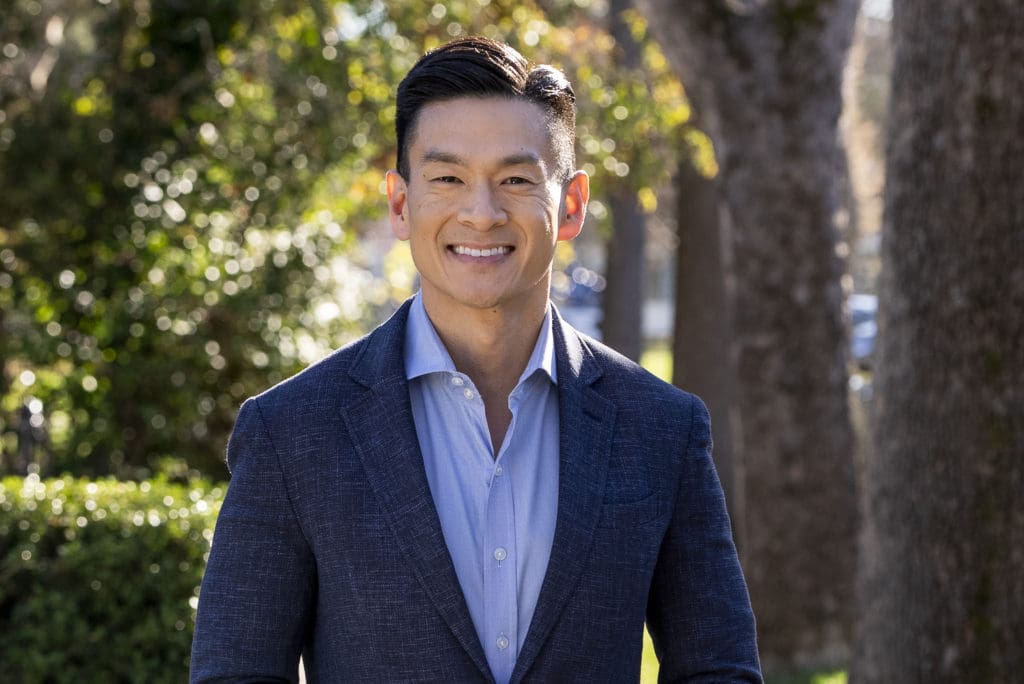
“This year’s Out for America report shows the continued resilience of our LGBTQ+ elected leaders. Despite hateful rhetoric plaguing the election cycle, LGBTQ+ elected officials are winning at the ballot box and making history. We know these exceptionally talented public servants are exactly what we need as the antidote to combat the anti-equality virus in our halls of power.”
– President and CEO of LGBTQ+ Victory Institute Evan Low.
Media requests and questions can be directed to
Pooja Prabhakaran at pooja.prabhakaran@victoryinstitute.org
LGBTQ+ Victory Institute’s Out for America report is an annual snapshot of the number of known out LGBTQ+ elected officials in the United States and their demographics. The Out for America 2026 report – released in June 2026 – reviews LGBTQ+ elected representation as of May 30, 2026, when the data is frozen. Any officials elected after this date are not included in these calculations.
LGBTQ+ Victory Institute tracks openly LGBTQ+ elected officials in the U.S. throughout the year at outforamerica.org. The Out for America report is compiled using data submitted by elected officials directly in addition to other primary sources of information like their websites and social media. LGBTQ+ Victory Institute uses secondary sources such as media coverage and partner records to validate the information included in the Out for America Report. The Institute team conducts thorough outreach to community organizations, political parties and its network of elected leaders and supporters to assist in identifying or confirming the information included in this report.
LGBTQ+ representation by the numbers (as of May 30, 2026)
There are 1,359 known out LGBTQ+ elected officials in the U.S.
0.26% of U.S. elected officials are LGBTQ+ and out.
There was a 2% increase in out LGBTQ+ elected officials since 2025.
An estimated 46,972 more out LGBTQ+ people must be elected to achieve equitable representation.
Between May 2025 and May 2026:
- LGBTQ+ elected officials increased by 2%, with 1,359 currently serving.
- Cisgender LGBTQ+ women in elected office decreased by 4.2%
- Native American/Alaska Native LGBTQ+ elected officials increased by 18.2% from 2025
- Transgender women representation stayed the same, while transgender men increased by 22.2 %
- LGBTQ+ statewide elected officials increased by 9.1% since 2025.
Since 2017:
- LGBTQ+ representation among elected officials has grown 203%
- The number of LGBTQ+ state legislators has grown by 125%
- The number of transgender elected officials has increased by 833%
- LGBTQ+ elected officials of color have increased by 421%
* According to Gallup in February 2025, 9.3% of U.S. adults identify as lesbian, gay, bisexual, transgender or something other than heterosexual. There are 519,682 U.S. elected positions, according to Becoming a Candidate, Jennifer L. Lawless. Therefore 46,972 LGBTQ+ elected officials would constitute equitable representation
Elected Positions
LGBTQ+ people continue to be heavily underrepresented at all levels of elected office, though we saw some slight gains between 2025-2026. The majority of LGBTQ+ elected officials are local, followed by those serving as state legislators.
The number of LGBTQ+ representation in Congress remained the same with only one senator, Tammy Baldwin, representing the LGBTQ+ community in the upper chamber. Statewide LGBTQ+ representation increased by 9.1% and the number of LGBTQ+ mayors increased by 6.1%.
out governors currently serve
The U.S. must elect 2 more LGBTQ+ governors for equitable representation (a total of 5 out of 55 state and territory governors).
out LGBTQ+ statewide executives currently serve
The U.S. must elect 21 more LGBTQ+ statewide executives for equitable representation (a total of 33 out of 358 state- and territory-wide executives).
out LGBTQ+ U.S. senator currently serves
The U.S. must elect 8 more LGBTQ+ U.S. senators for equitable representation (a total of 9 out of 100 U.S. senators).
U.S. House members currently serve
The U.S. must elect 29 more LGBTQ+ members of the U.S. House for equitable representation (a total of 41 out of 441 U.S. representatives or delegates).
out LGBTQ+ state legislators currently serve
States, territories and the District of Columbia must elect 459 more out LGBTQ+ state and territory legislators for equitable representation (a total of 704 out of 7,572 legislators).
out LGBTQ+ mayors currently serve
The U.S. must elect 51 more LGBTQ+ mayors for equitable representation (a total of 121 out of approximately 1,300).
out LGBTQ+ local officials currently serve
The U.S. must elect ten of thousands more LGBTQ+ local officials for equitable representation.
out LGBTQ+ elected judicial officials currently serve
The U.S. must elect more than 2,000 LGBTQ+ local and state judges for equitable representation.
Race & Ethnicity
LGBTQ+ Latinx/Hispanic elected officials continue to be the largest non-white group with 14.3% of all LGBTQ+ elected officials. Native American/Alaska Native had an 18.2% increase from 2025. While the number of AAPI LGBTQ+ elected officials increased significantly from 2024 to 2025, in 2026, the number decreased by 10.5%. Middle Eastern/Arab American LGBTQ+ elected officials also decreased by 10% from 2025-2026.
The number of Black/African American/Afro-Caribbean LGBTQ+ elected officials had a less than 1% increase (152 in 2025; 153 in 2026) — a smaller increase compared to 2024 to 2025.
From 2025 to 2026, LGBTQ+ Victory Institute recorded a:
increase in Latinx/Hispanic LGBTQ+ elected officials (195)
decrease in Asian/Pacific Islander LGBTQ+ elected officials (51)
increase in Native American/Alaska Native LGBTQ+ elected officials (13)
increase in white LGBTQ+ elected officials (851)
decease in Middle Eastern/Arab American LGBTQ+ elected officials (9)
increase in Black/African-American/Afro-Caribbean LGBTQ+ elected officials (153)
Note: An LGBTQ+ elected official may appear in more than one race or ethnicity category, resulting in totals higher than the count of elected officials. 67 individuals are reported as unknown race or ethnicity.
Gender Identity & Expression
LGBTQ+ elected officials continue to represent the full diversity of the gender spectrum, however the majority identity as cisgender (84.3%). Transgender, gender non-conforming, nonbinary, and Two Sprit elected officials represent 9.4% of the total.
In 2026, the number of transgender men increased 22.2%, while the number of transgender women stayed the same. The number of cisgender women decreased by 4.2% from 473 in 2025 to 453 in 2026. The number of cisgender men continue to increase with almost a 1% increase from 2025 to 2026.
of LGBTQ+ elected officials are cisgender
increase in transgender men
decrease in cisgender LGBTQ+ women elected officials
increase in transgender elected officials
increase in gender non-conforming, non-binary, genderqueer and Two Spirit elected officials
increase in cisgender LGBTQ+ men elected officials
Note: Similar to race and sexual orientation, one may select more than one gender identity, which may result in percentage totals above 100%. 78 individuals have an unknown or unreported gender identity.
Sexual Orientation
Nearly half of LGBTQ+ elected officials report as gay (48%) with a 2.2% increase from 2025, while the number reporting as lesbian (the second largest category at 19.6%) decreased by nearly 1%. In 2026 the number of LGBTQ+ elected officials who identify as bisexual increased by 1.3%, making up 11.8% of all LGBTQ+ elected officials.
decrease in asexual elected officials
decrease in pansexual elected officials
increase in bisexual elected officials
decrease in lesbian elected officials
increase in gay men elected officials
decrease in queer elected officials
Note: Similar to other demographics, one may select more than one sexual orientation which may result in percentage totals above 100%. 95 individuals have an unknown or unreported sexual orientation.
Party Affiliation
While the number of Republican LGBTQ+ elected officials had the highest growth compared to 2025 (11.5% increase), Democrats continue to hold the overwhelming majority at 74% of total LGBTQ+ elected officials. The number of Independent LGBTQ+ elected officials also increased by 10.3%
Party Affiliation of U.S. LGBTQ+ Elected Officials by Year
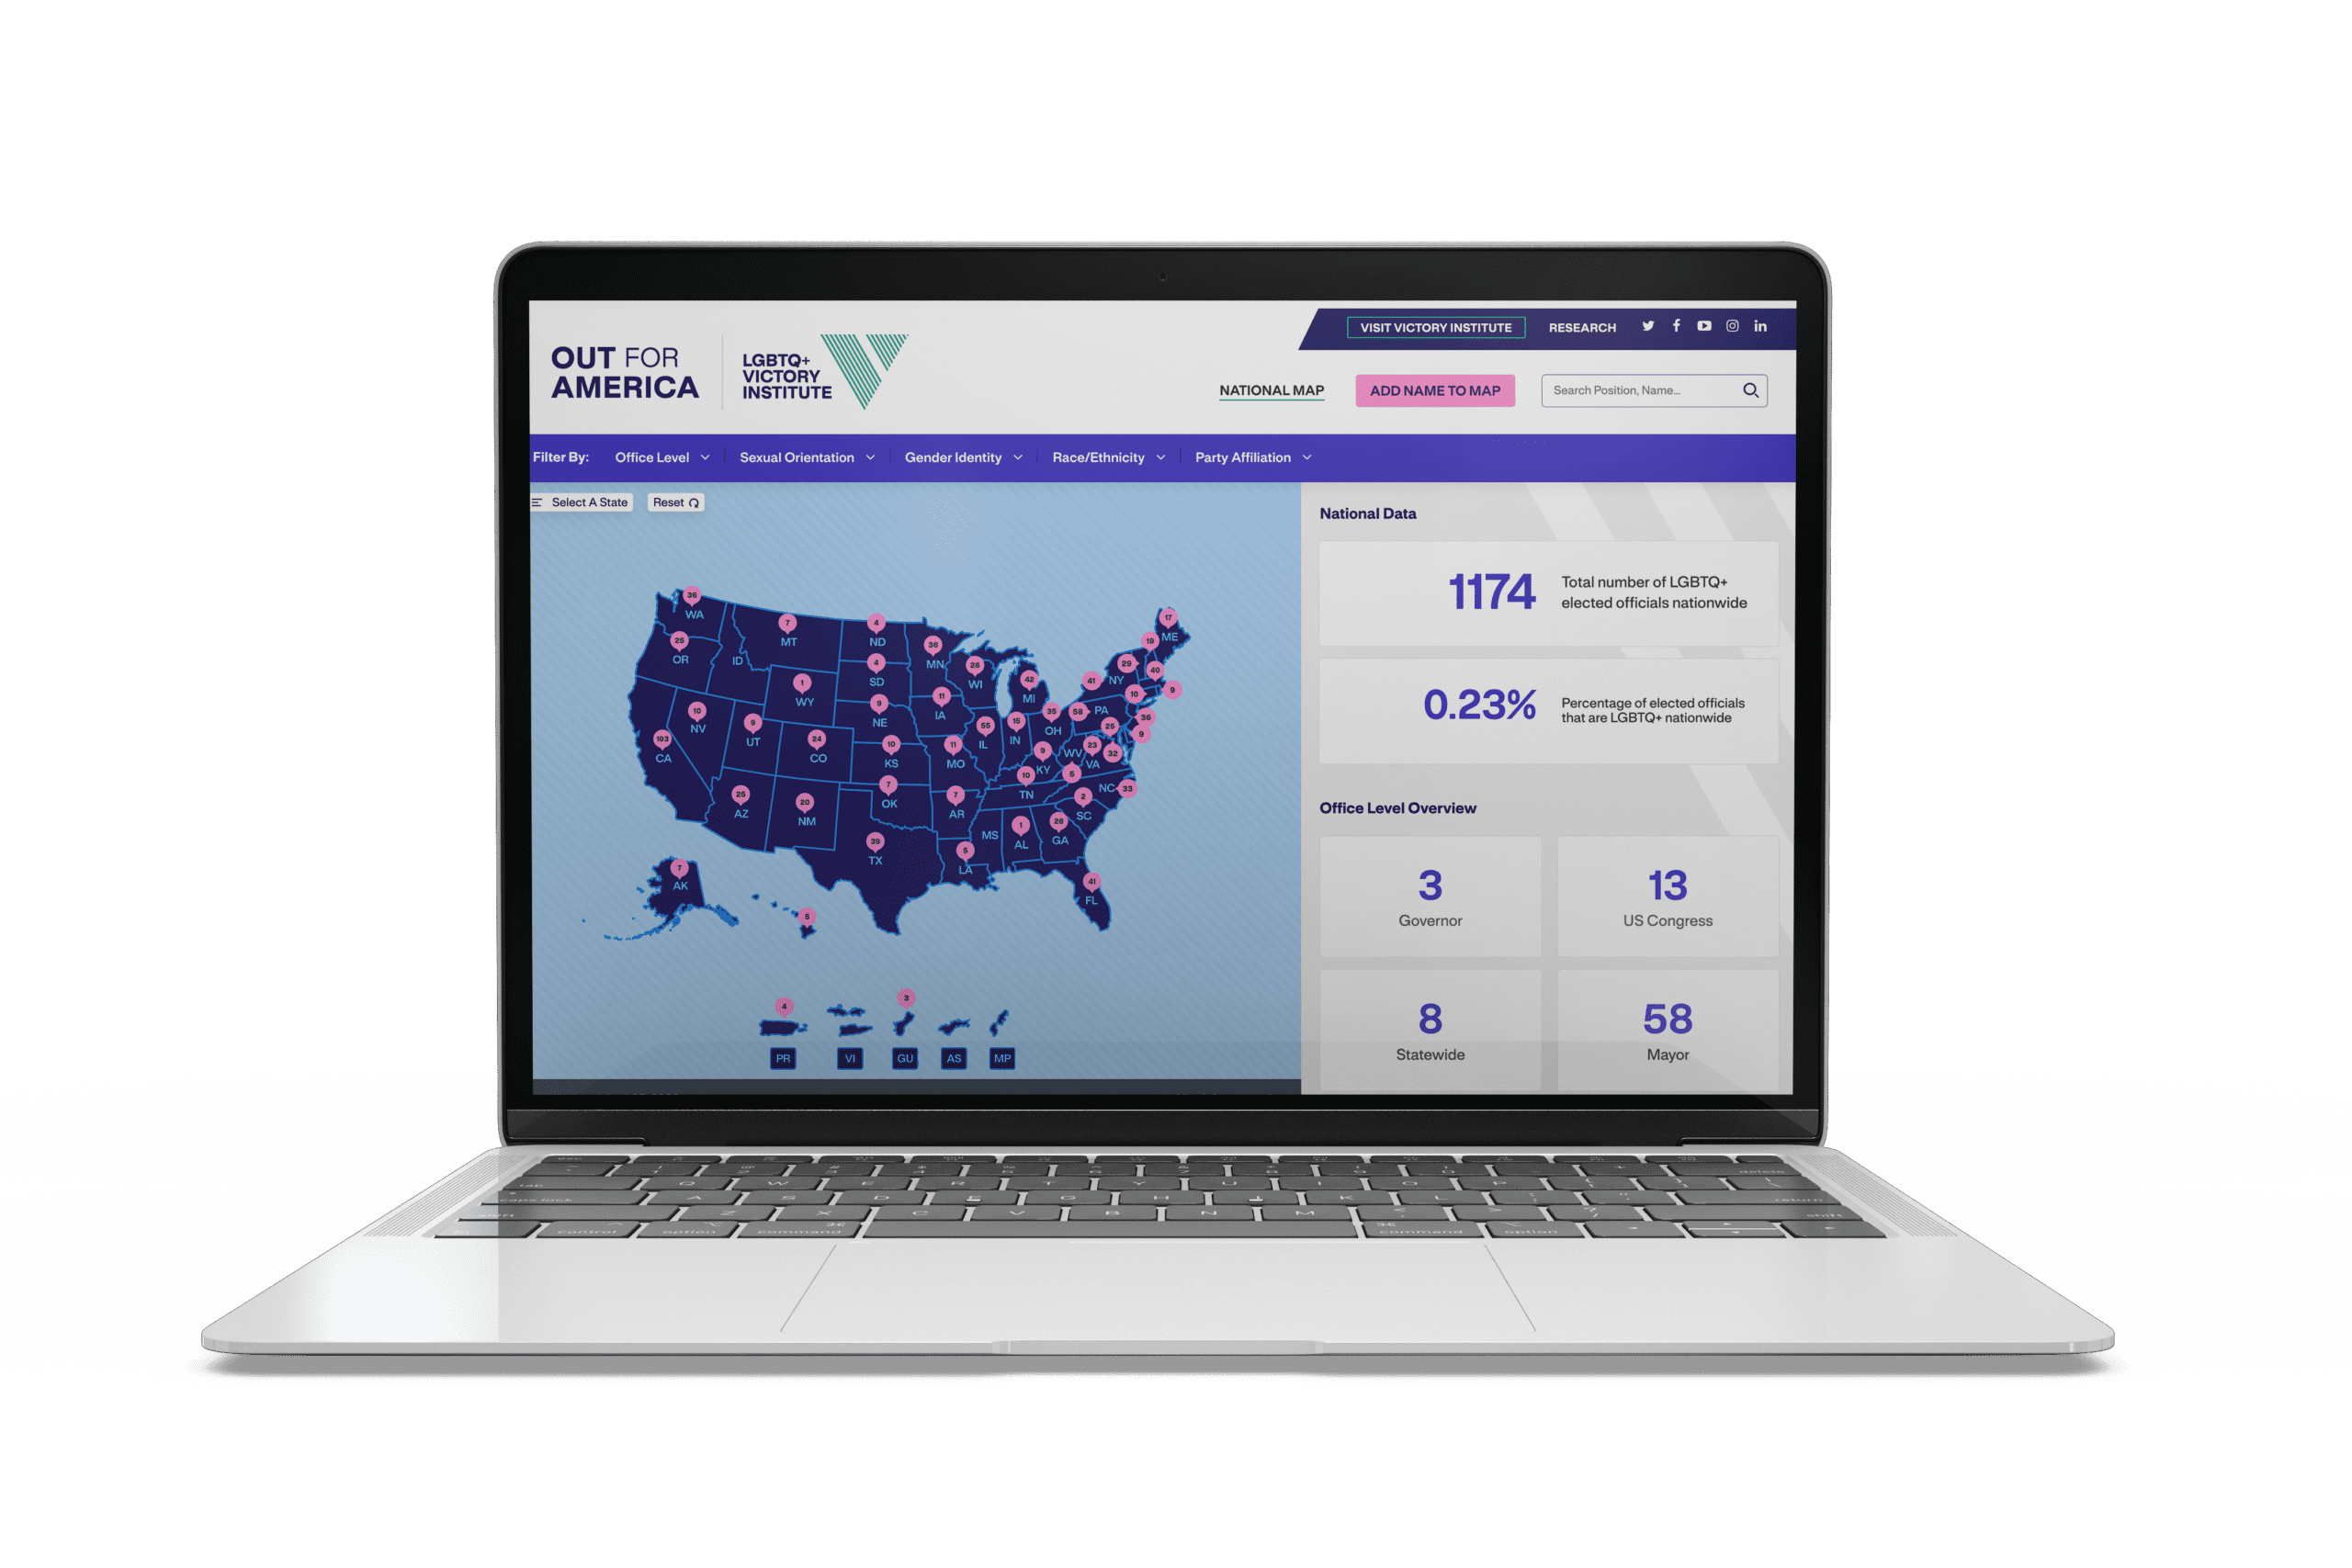
Out for America Map
Our Out for America map is the most comprehensive database on known out LGBTQ+ elected officials in the United States. The map is updated daily to show the current state of LGBTQ+ representation in elected government.
First published in November 2017, Out for America is LGBTQ+ Victory Institute’s annual analysis of the state of LGBTQ+ representation in America. While the increase in LGBTQ+ elected officials each year is primarily due to the election of new LGBTQ+ individuals, part of the increase can also be attributed to people coming out while in office and the Victory Institute’s efforts to identify more LGBTQ+ people already in elected office.
You can view previous Out for America reports below:

Support LGBTQ+ Victory Institute
LGBTQ+ Victory Institute works around the globe to ensure strong democracies that reflect all of us. Through campaign trainings, leadership programs, research and convenings, LGBTQ+ Victory Institute is the leading global organization seeking to grow and diversify the pipeline of LGBTQ+ public leaders.
Join us as a supporter with a tax-deductible donation today!