
“From school boards to state legislatures to Congress, LGBTQ+ political power continues to grow across the country. LGBTQ+ leaders are our best firewall against the homophobia and transphobia sweeping our communities. As LGBTQ+ elected officials stand up and speak out on behalf of all of us, they are also inspiring countless LGBTQ+ leaders to consider running for office themselves. This is an all-hands-on-deck moment for the LGBTQ+ community and our allies: we must double down on our efforts to inspire, train and support future LGBTQ+ candidates – our rights will depend on it.”
– Mayor Annise Parker, President & CEO of LGBTQ+ Victory Institute
Media requests can be directed to
press@victoryfund.org
Key Findings
LGBTQ+ Victory Institute’s Out for America report is an annual snapshot of the number of known out LGBTQ+ elected officials in the United States and their demographics. The 2023 Out for America report — released in June 2023 — reviews LGBTQ+ elected representation as of May 19, 2023.
There are
known out LGBTQ+ elected officials in the U.S.
of U.S. elected officials are LGBTQ+
more LGBTQ+ people must be elected to achieve equitable representation**
Between June 2022 and May 2023:
- LGBTQ+ elected officials increased by 13.6 percent, with 1,185 currently serving;
- LGBTQ+ school board members increased by 37 percent, to 124 currently serving;
- Non-binary elected officials increased by 91.7 percent with 23 now serving;***
- There was a significant growth in the number of pansexual and bisexual elected officials, with a 65 percent and 34 percent increase respectively;
- Growth in lesbian elected officials nearly stalled – with an increase of just 0.8 percent – after a 2.2 percent decline between 2021 and 2022;
- LGBTQ+ elected officials of color increased by 23.2 percent while white LGBTQ+ elected officials increased by nine percent;
- The number of LGBTQ+ elected officials of Middle Eastern or Arab American heritage more than doubled; and
- Latinx LGBTQ+ elected officials increased by 27 percent, compared to 19 percent for Asian American Pacific Islander LGBTQ+ elected officials and 17 percent for Black LGBTQ+ elected officials.
Currently:
- America must elect 36,232 more LGBTQ+ elected officials in order to achieve equitable representation in government;
- Idaho and Mississippi are the only states with zero out LGBTQ+ elected officials and Idaho, Louisiana, Mississippi and West Virginia are the only states with zero out LGBTQ+ state legislators;
- 226 LGBTQ+ state legislators are serving – the most ever and an increase of 18 percent since 2022;
- 24 states and the District of Columbia have trans elected officials and 14 states have non-binary elected officials;
- Three out governors are serving, the most ever and up from two in 2022; and
- LGBTQ+ elected officials are significantly more racially and ethnically diverse than elected officials overall, but remain less racially and ethnically diverse than the U.S. population.
Since the first Out for America report was released in 2017, LGBTQ+ representation in elected office has increased between 5.8 percent and 25 percent each year — a strong pace. Yet LGBTQ+ people remain extremely underrepresented in elected office, holding just 0.23 percent of elected positions in the United States
increase in LGBTQ+ elected officials in the last year (June 2022 – May 2023)
increase in LGBTQ+ elected officials since first Out for America report (2017-2023)
* 7.2% of the voting age population in the U.S. is LGBTQ, according to Gallup, Feb. 2023.
** There are 519,682 U.S. elected positions, according to Becoming a Candidate, Jennifer L. Lawless.
*** This includes elected officials who identify as transgender non-binary, non-binary or genderqueer/non-binary, to reflect updated demographic options provided by Victory Institute. In 2022, only non-binary was provided as a demographic option.
Elected Positions
LGBTQ+ people are severely underrepresented at nearly every level of government and in nearly every public position in the United States.

governors
The U.S. must elect 1 more LGBTQ+ governor for equitable representation (a total of 4 out of 55 state and territory governors).

statewide executives*
The U.S. must elect 16 more LGBTQ+ statewide executives for equitable representation (a total of 23 out of 325 state- and territory-wide executives).

U.S. senators
The U.S. must elect 5 more LGBTQ+ U.S. senators for equitable representation (a total of 7 out of 100 U.S. senators).

U.S. House members
The U.S. must elect 21 more LGBTQ+ U.S. representatives for equitable representation (a total of 31 out of 435 U.S. representatives).

state legislators*
States, territories and the District of Columbia must elect 319 more out LGBTQ+ state legislators for equitable representation (a total of 545 out of 7,572 legislators).
mayors
The U.S. must elect hundreds more LGBTQ+ mayors for equitable representation.

local officials (excluding mayors and school board members)
The U.S. must elect more than 15,000 more LGBTQ+ local officials for equitable representation.

elected judicial officials
The U.S. must elect thousands more LGBTQ+ judicial officials for equitable representation.
school board members
The U.S. must elect thousands more LGBTQ+ school board members for equitable representation.
* Statewide executives include two territory-wide elected officials in Guam. State legislators include one senator in the U.S. Virgin Islands, one senator in Puerto Rico and one member of the Council of the District of Columbia.
Race & Ethnicity
From June 2022 to May 2023, LGBTQ+ elected officials of all races and ethnicities grew at a faster pace than overall LGBTQ+ elected officials, with the exception of white LGBTQ+ elected officials, which grew at a lesser rate (9.1 percent) than LGBTQ+ elected officials overall (13.6 percent).
Note: Percentages are calculated using the known race and ethnicity demographics. The numbers below include six officials who selected two races/ethnicities.
increase in LGBTQ+ elected officials of color
increase in white LGBTQ+ elected officials
increase in Asian American & Pacific Islander LGBTQ+ elected officials
increase in Black LGBTQ+ elected officials
increase in Latinx LGBTQ+ elected officials
increase in Middle Eastern/Arab American LGBTQ+ elected officials
Sex and Gender
From June 2022 to May 2023, transgender and non-binary LGBTQ+ elected officials increased at a significantly higher rate than cisgender LGBQ elected officials (by 24 percent and 10.5 percent, respectively). Now transgender and non-binary elected officials account for 8.1 percent of all LGBTQ+ elected officials, up from 6.9 percent in June 2022. There are currently zero known out intersex elected officials.
Note: Percentages are calculated using the known gender identity demographics.
of LGBQ elected officials are cisgender
of LGBTQ+ elected officials are transgender or non-binary
increase in non-binary elected officials
increase in transgender elected officials
increase in LGBQ cisgender women elected officials
increase in GBQ cisgender men elected officials
Sexual Orientation
From June 2022 to May 2023, pansexual and bisexual elected officials grew at a faster rate than most other sexual orientations, yet the number of lesbian elected officials remained nearly stagnant, after decreasing in number between 2021 and 2022.
Note: Percentages are calculated using the known sexual orientation demographics. The numbers below include eight people who selected two sexual orientations.
increase in bisexual elected officials
increase in pansexual elected officials
increase in queer elected officials
increase in gay men elected officials
increase in lesbian elected officials
increase in asexual elected officials
Party Affiliation
From June 2022 to May 2023, the percentage of LGBTQ+ elected officials who identify as Democrats, Republicans and Independents remained nearly unchanged. Democrats now represent 75.3 percent of LGBTQ+ elected officials, Republicans 2.8 percent and Independents 2.4 percent.
Party Affiliation of U.S. LGBTQ Elected Officials by Year
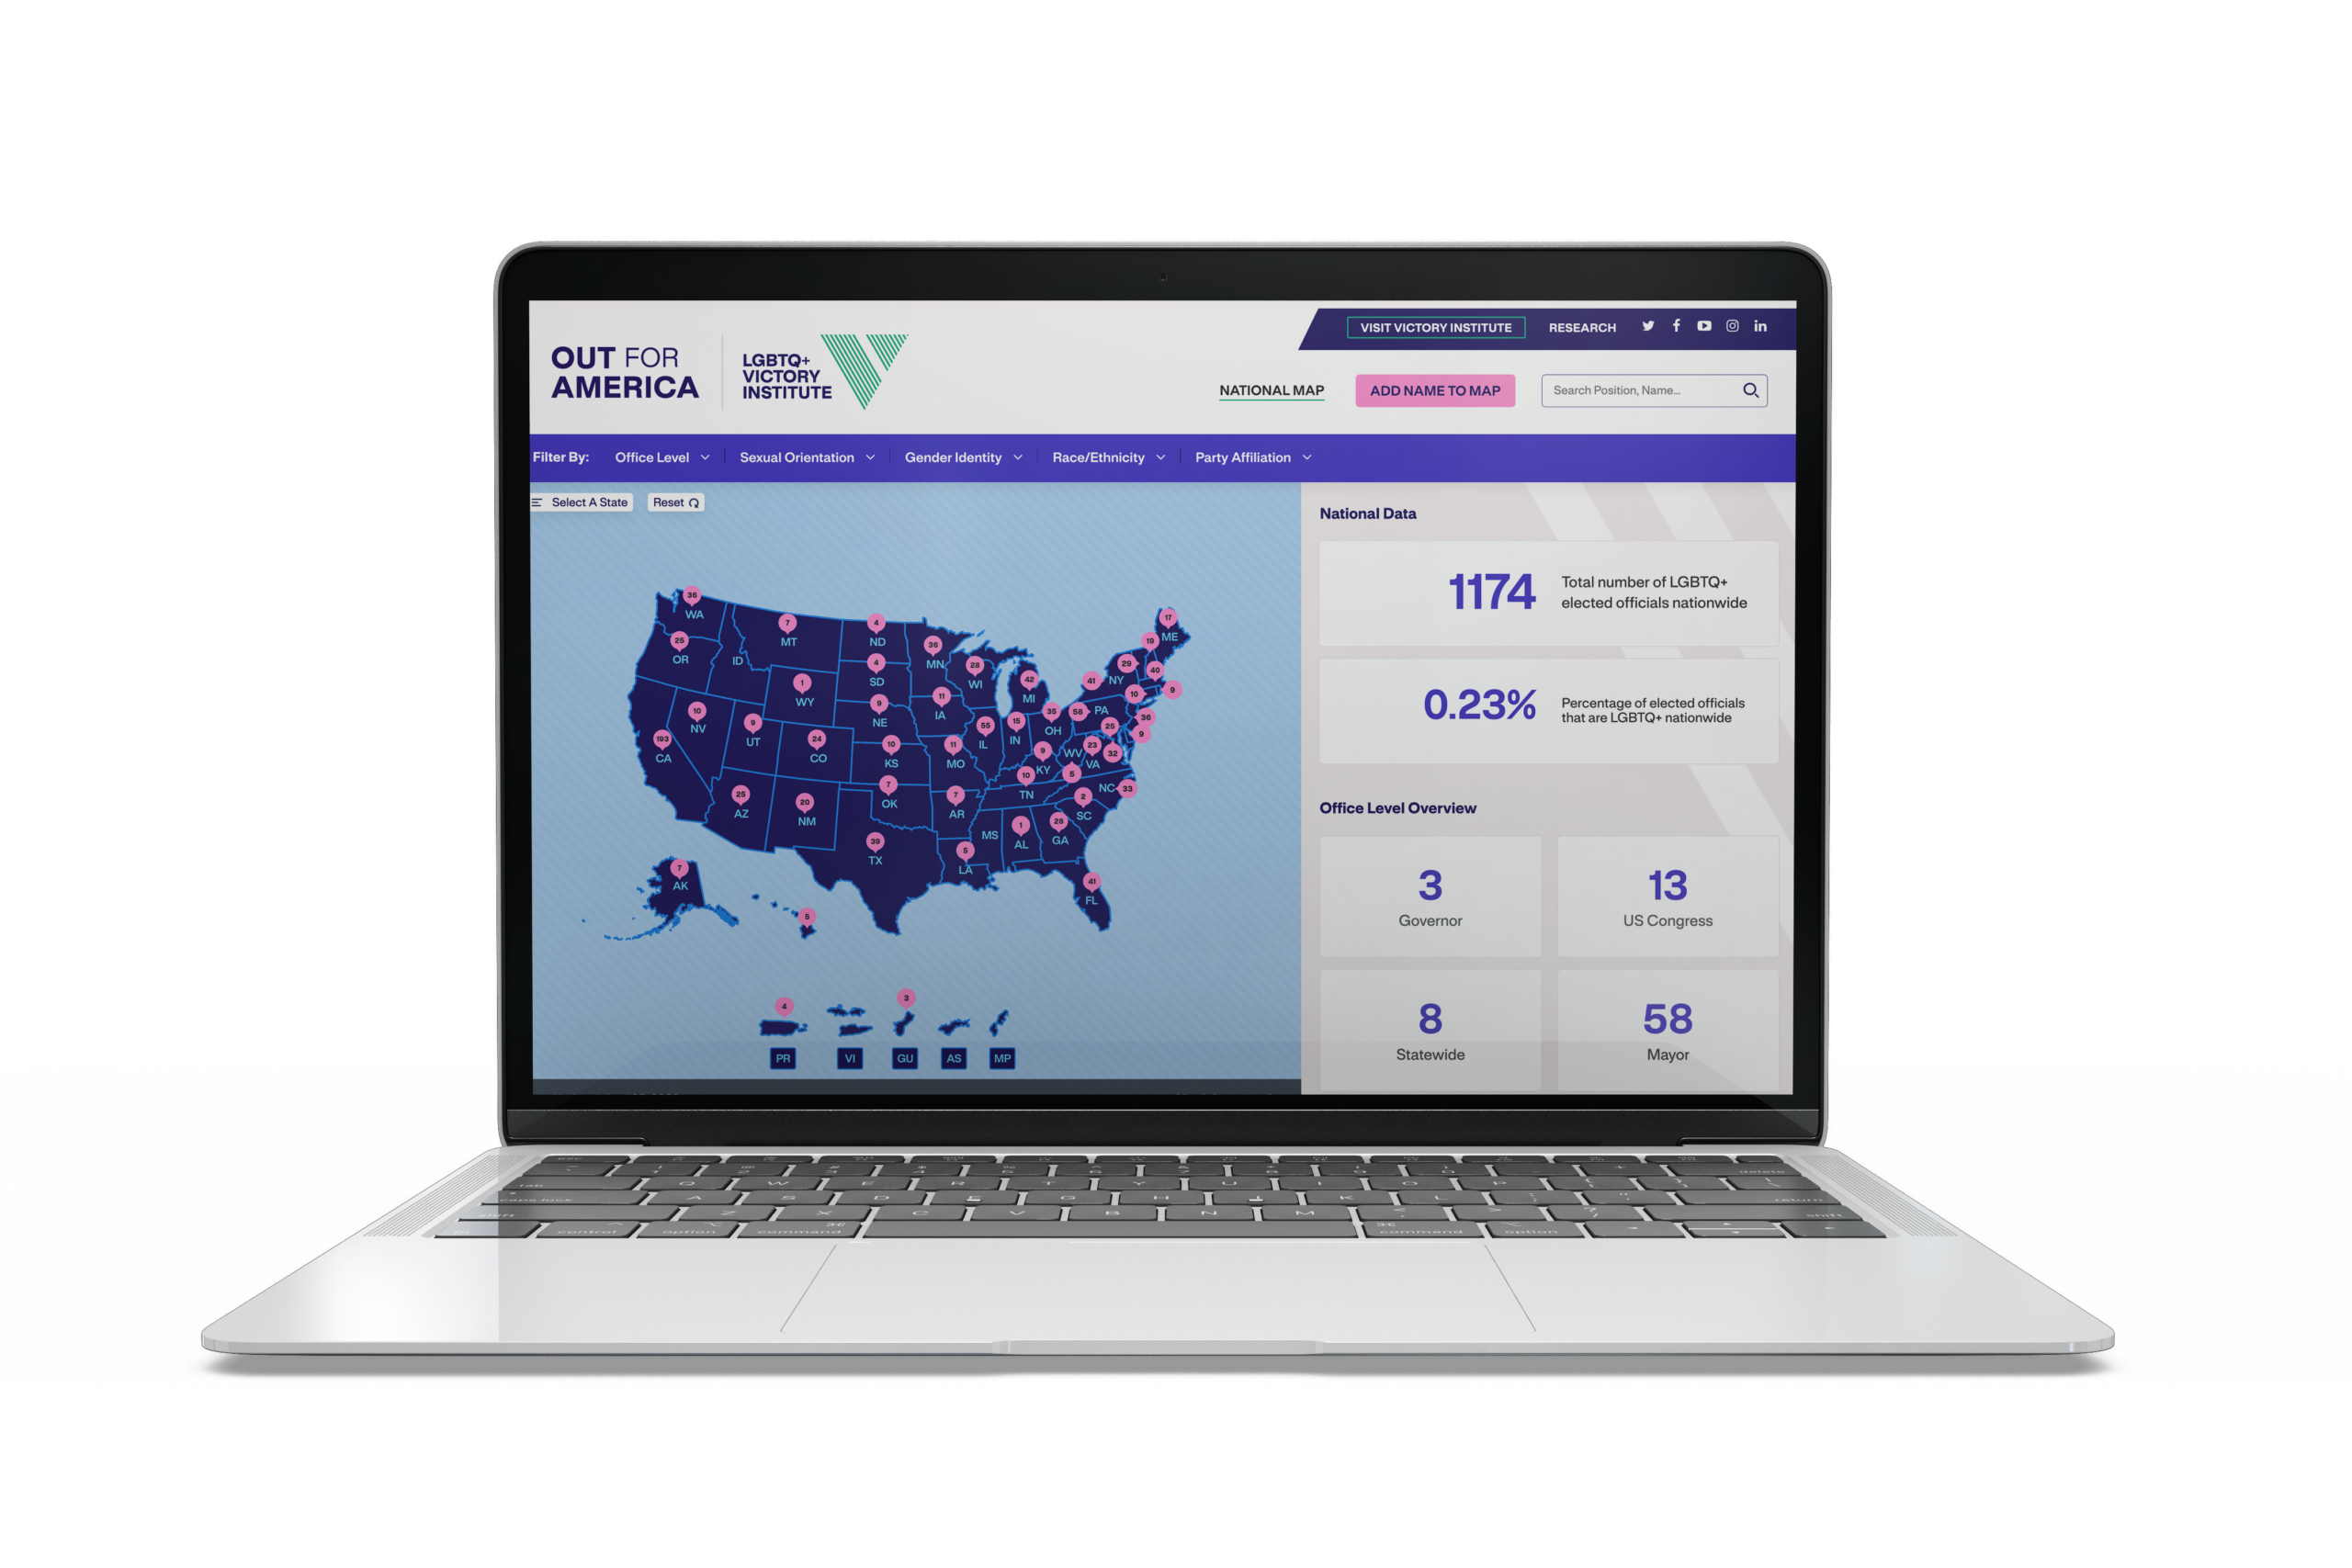
Out for America Map
Our Out for America map is the most comprehensive database on known out LGBTQ+ elected officials in the United States. The map is updated daily to show the current state of LGBTQ+ representation in elected government.
First published in November 2017, Out for America is LGBTQ+ Victory Institute’s annual analysis of the state of LGBTQ representation in America. While the increase in LGBTQ elected officials each year is primarily due to new LGBTQ people being elected, part of the increase can be attributed to people coming out while in office and Victory Institute’s efforts to identify more LGBTQ people already in elected office.
You can view previous Out for America reports below:
![]()
Support LGBTQ+ Victory Institute
LGBTQ+ Victory Institute works around the globe to ensure strong democracies that reflect all of us. Through campaign trainings, leadership programs, research and convenings, LGBTQ+ Victory Institute is the leading global organization seeking to grow and diversify the pipeline of LGBTQ+ public leaders.
Join us as a supporter with a tax-deductible donation today!