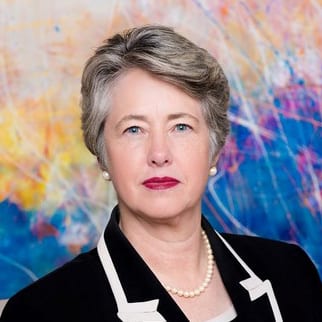
“LGBTQ Victory Institute is excited to present you with the 2021 Out for America report – our annual analysis of LGBTQ elected representation in the United States. Over the past year, we’ve seen an incredible jump in the number of LGBTQ people elected to public office — and they are becoming more representative of our entire community as well. These public servants are leading the way in passing conversion therapy bans in city councils, fighting anti-trans bills in state legislatures and in passing the Equality Act in the U.S. House. Yet we still must elect 28,116 more LGBTQ people to public office before equitable representation is achieved and we must ensure those leaders are as diverse as our community. This report shows you where we are and how we get there — I hope you enjoy it.”
– Mayor Annise Parker, President & CEO of LGBTQ Victory Institute
Media Contact
Media requests can be directed to:
Elliot Imse, Vice President of Communications, 202.567.3345 ext. 345
Key Findings
LGBTQ Victory Institute’s Out for America report is an annual snapshot of the number of known out LGBTQ elected officials in the United States and their demographics. The Out for America 2021 report — released in July 2021 — reviews LGBTQ elected representation as of June 2021.
known out LGBTQ elected officials in the U.S.
of U.S. elected officials are LGBTQ
of U.S. population is LGBTQ*
more LGBTQ people must be elected to achieve equitable representation**
Between June 2020 and June 2021:
- LGBTQ elected officials increased by 17 percent, with 986 currently serving;
- LGBQ cisgender women state legislators surpassed the number of GBQ cisgender men state legislators for the first time;
- LGBTQ elected officials of color grew at a much faster pace than white LGBTQ elected officials, with Black LGBTQ elected officials growing at the fastest pace;
- Queer elected officials grew faster than all other sexual orientations, with an 83 percent increase;
- Non-cisgender elected officials grew faster than cisgender elected officials, with genderqueer/non-binary and trans women elected officials increasing the most; and
- Neither trans men nor intersex people saw an increase in elected representation.
Currently:
- LGBTQ people are severely underrepresented among elected officials, needing to elect 28,116 more to achieve equitable representation;
- LGBTQ elected officials are significantly more racially and ethnically diverse than the overall elected official population, but are less diverse than the U.S. population;
- Mississippi is the only state in the nation with zero known out LGBTQ elected officials serving;
- 23 states have transgender elected officials serving and 29 states have non-cisgender elected officials;
- LGBTQ people are equitably represented among mayors of top 100 cities for the first time (with six), but are underrepresented among mayors overall and in all other public positions; and
- 84 percent of LGBTQ elected officials are Democrats and just three percent are Republicans.
*According to Gallup.
** There are 519,682 U.S. elected positions, according to Becoming a Candidate, Jennifer L. Lawless.
Elected Positions
LGBTQ people are severely underrepresented at every level of government, but for the first time are equitably represented among mayors of top 100 cities (with six LGBTQ mayors). Yet LGBTQ people remain underrepresented among mayors overall, as well as in every other public elected position.

governors
The U.S. must elect 1 more governor for equitable representation (a total of 3 out of 50 governors).

statewide executives*
The U.S. must elect 13 more statewide executives for equitable representation (a total of 19 out of 346 statewide executives).

U.S. senators
The U.S. must elect 4 more U.S. senators for equitable representation (a total of 6 out of 100 U.S. senators).

U.S. House members
The U.S. must elect 15 more U.S. representatives for equitable representation (a total of 24 out of 435 U.S. representatives).

state legislators*
The U.S. must elect 224 more state legislators for equitable representation (a total of 413 out of 7,383 state legislators).

mayors
The U.S. must elect 72 more mayors of cities with 30,000+ population for equitable representation (from 19 to 91 of 1,621 mayors).

local officials
The U.S. must elect more than 15,000 more local officials for equitable representation.

judicial officials
The U.S. must elect thousands more judicial officials for equitable representation.
* Statewide executives include two territory-wide elected officials in Guam and state legislators include one senator in the U.S. Virgin Islands and another in Puerto Rico.
Race & Ethnicity of LGBTQ Elected Officials
From June 2020 – June 2021, LGBTQ elected officials of color grew at significantly greater rates than white LGBTQ elected officials, yet white LGBTQ elected officials remain overrepresented among LGBTQ elected officials overall.
increase in LGBTQ elected officials of color
increase in white LGBTQ elected officials
increase in Black LGBTQ elected officials
increase in Asian & Pacific Islander LGBTQ elected officials
increase in multiracial LGBTQ elected officials
increase in Latinx LGBTQ elected officials
While LGBTQ elected officials are significantly more racially and ethnically diverse than the overall elected official population, they remain less racially and ethnically diverse than the U.S. population.
Racial/Ethnic Diversity by Population Group
Sex and Gender of LGBTQ Elected Officials
From June 2020 – June 2021, non-cisgender LGBTQ elected officials outgrew cisgender LGBQ elected officials, yet cisgender LGBQ elected officials remain overrepresented among LGBTQ elected officials. Also, for the first time, cisgender LGBQ women state legislators outnumber cisgender GBQ men state legislators.
increase in non-cisgender LGBTQ elected officials
increase in cisgender LGBQ elected officials
increase in GNC / genderqueer / non-binary elected officials
increase in trans women elected officials
increase in cisgender women elected officials
increase in cisgender men elected officials
Sexual Orientations of LGBTQ Elected Officials
From June 2020 – June 2021, queer LGBTQ elected officials grew at a faster rate than LGBTQ elected officials of any other sexual orientation by far — and for the second year in a row. Queer LGBTQ elected officials increased by 525 percent since June 2018.
increase in queer elected officials
increase in bisexual elected officials
increase in pansexual elected elected officials
increase in gay elected officials
increase in lesbian elected officials
Party Affiliation of LGBTQ Elected Officials
From June 2020 – June 2021, party affiliations of LGBTQ elected officials remained relatively steady, with just 26 of 986 identifying as Republicans.
Party Affiliation
Party Affiliation by Year

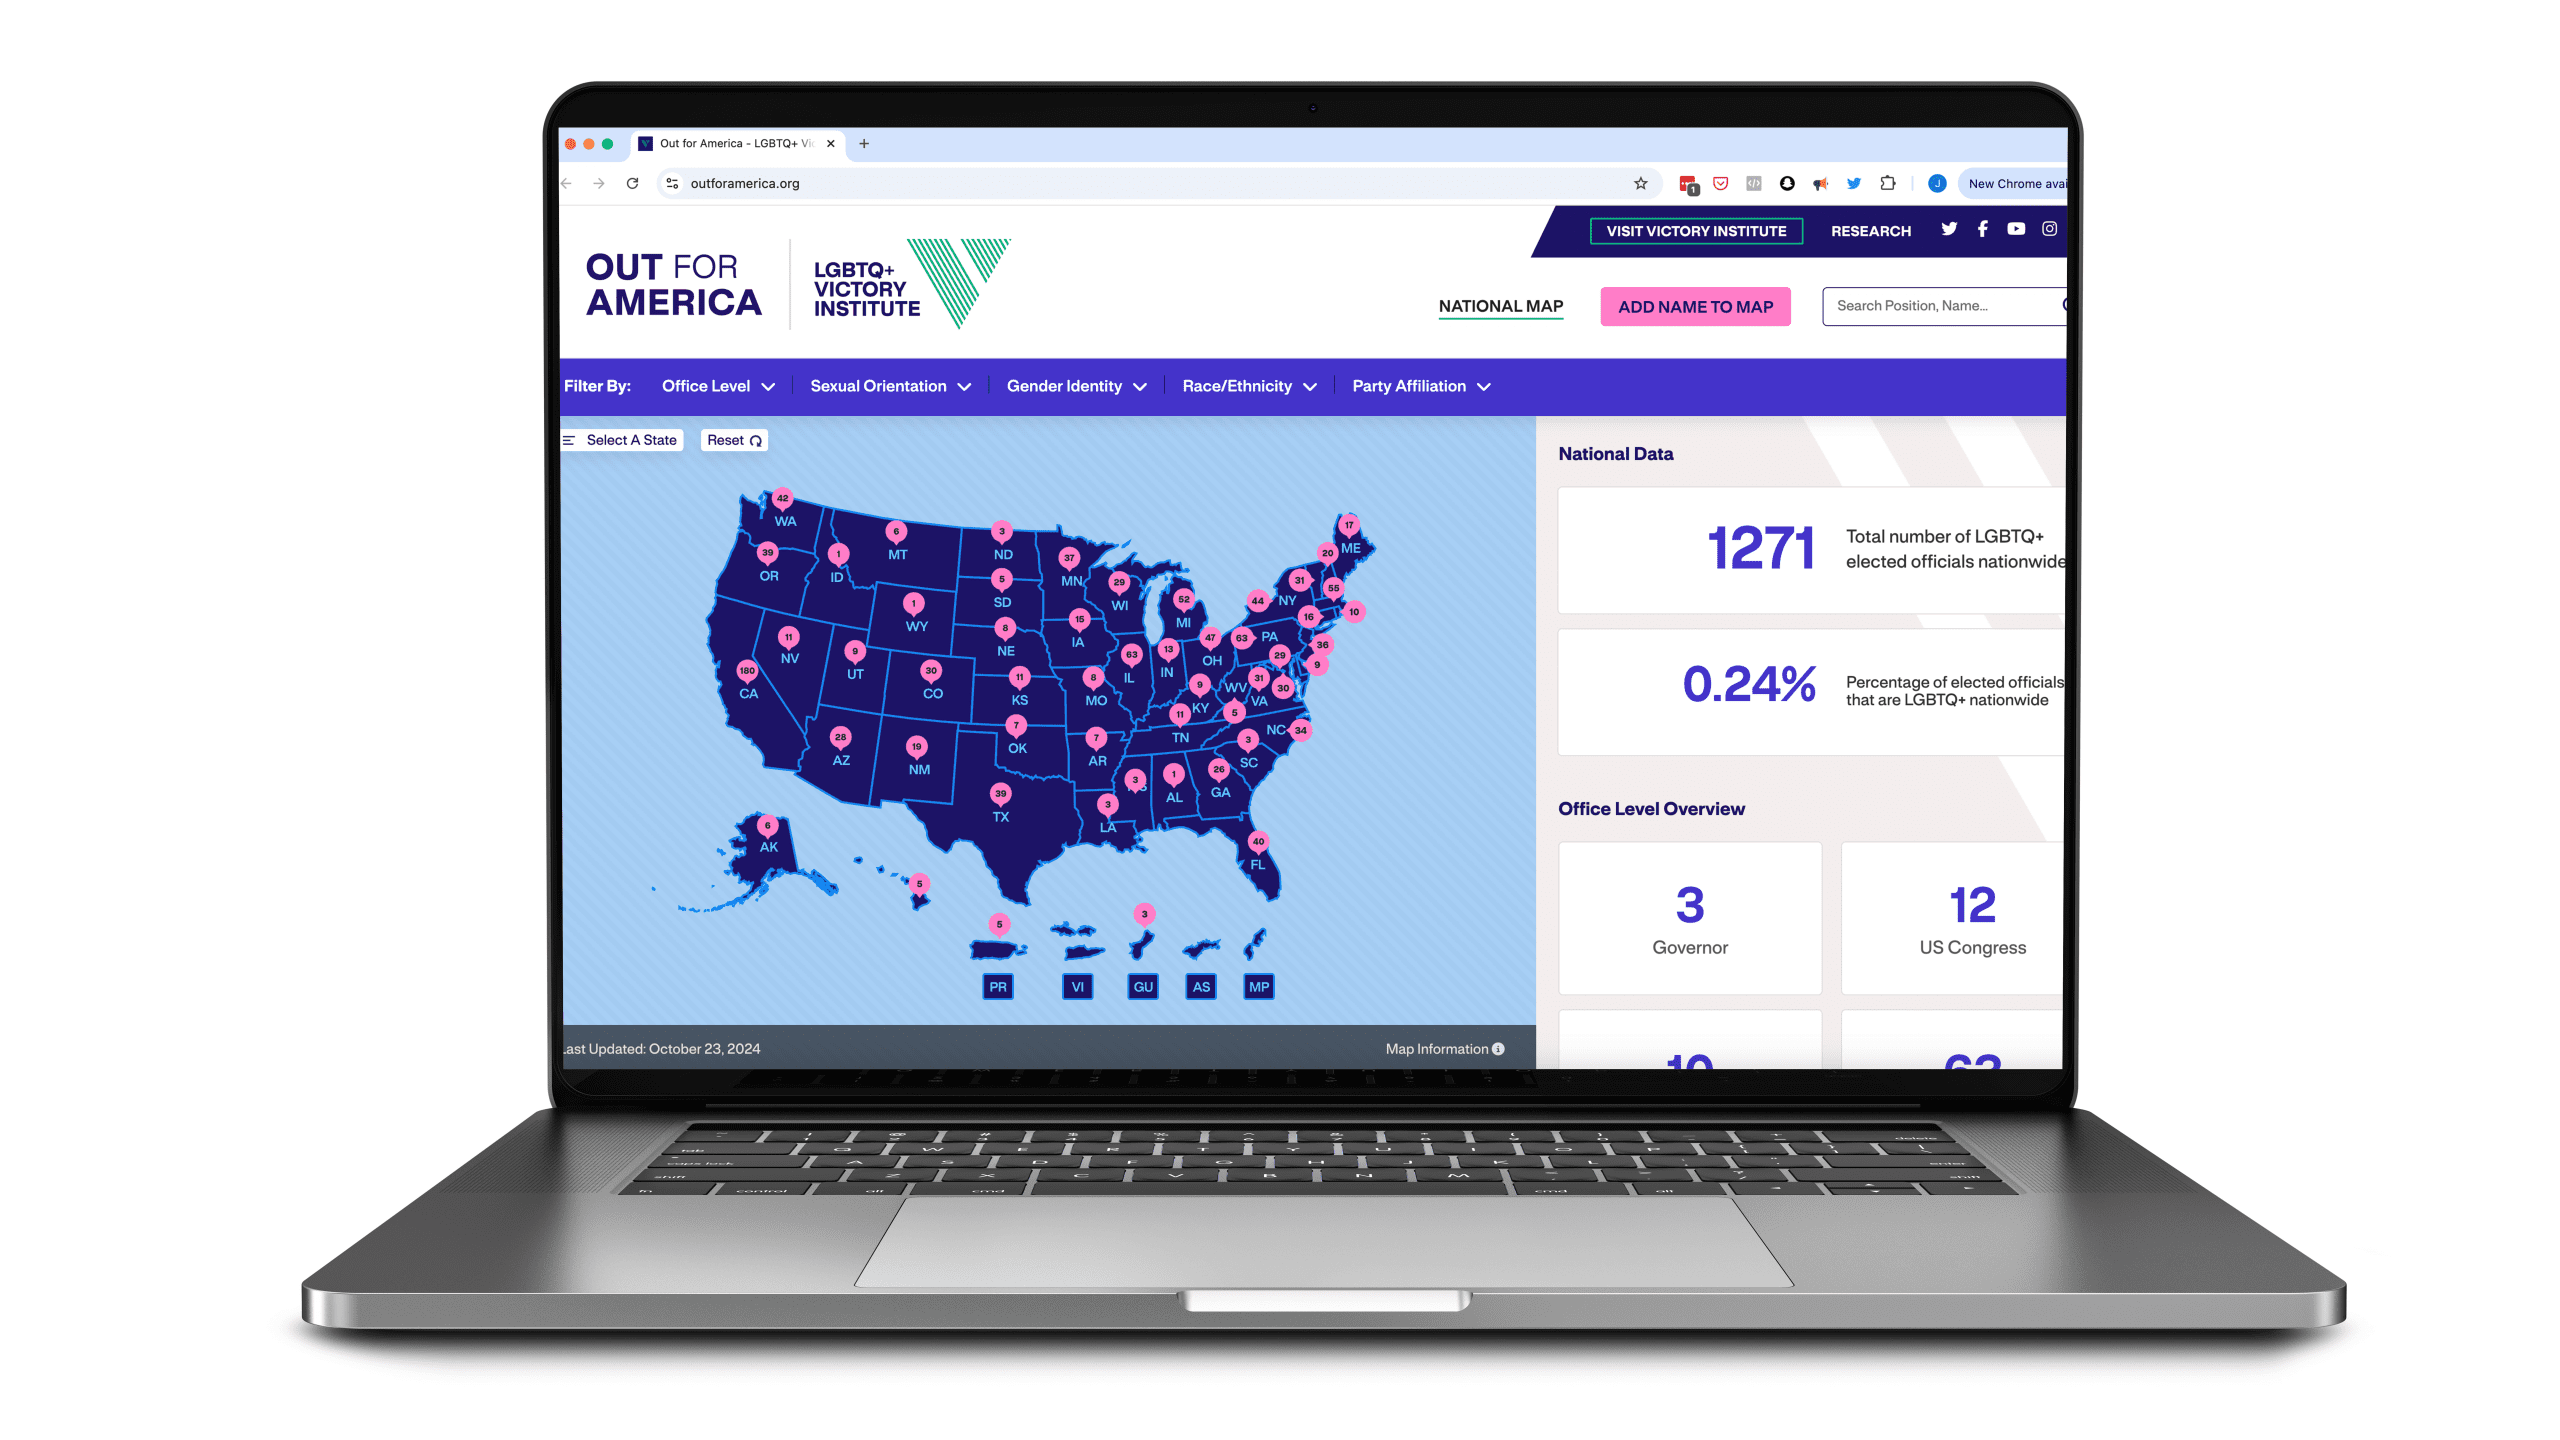
Out for America Map
Our Out for America map is the most comprehensive database on known openly LGBTQ elected officials in the United States. The map is updated weekly to show the current state of LGBTQ representation in elected government.

Out for America is LGBTQ Victory Institute’s annual analysis of the state of LGBTQ representation in America. First published in November 2017, the report has since been released annually each summer. While the increase in LGBTQ elected officials each year is primarily due to new LGBTQ people being elected, part of the increase can be attributed to people coming out while in office and Victory Institute’s efforts to identify more LGBTQ people already in elected office.
You can view previous Out for America reports below: