“LGBTQ Victory Institute is pleased to present you with the 2020 Out for America report – our annual analysis of LGBTQ elected representation in the United States. While LGBTQ people are running for office in historic numbers, we remain severely underrepresented at every level of government – and that must change. We know that when LGBTQ people are in elected office and in the halls of power, they change the hearts and minds of their colleagues and it leads to more inclusive legislation. Enjoy exploring the current state of LGBTQ representation in the United States and I hope you join us in our efforts to build a pipeline of LGBTQ leaders who will change our nation for the better.”
– Mayor Annise Parker, President & CEO of LGBTQ Victory Institute
Key Findings
The number of known openly LGBTQ elected officials in the United States continues to increase at a rapid pace, despite fewer elections being held in the “off-election” year of 2019. The key numbers below represent the current state of representation as of June 2020 and the growth in representation between June 2019 and June 2020.
known openly LGBTQ elected officials in the U.S.
increase in LGBTQ elected officials
increase in LGBTQ mayors
increase in bisexual elected officials
increase in queer elected officials
increase in trans women elected officials

“Over the past year, LGBTQ elected officials have been on the frontlines — leading efforts to end racism, blocking bills targeting the trans community and passing legislation that moves equality forward for our community. Allies are important, but LGBTQ representation in the halls of power is critical to the success of our movement.”
– Ruben Gonzales, Executive Director of LGBTQ Victory Institute
State of Representation
While the number of known openly LGBTQ elected officials has grown by 88 percent since our first report in November 2017, LGBTQ people remain severely underrepresented in government. LGBTQ people are at least 4.5 percent of the U.S. adult population, but hold just .17 percent of elected positions nationwide.
known openly LGBTQ elected officials in the U.S. (June 2020)
of U.S. adults identify as LGBTQ*
of U.S. elected officials identify as LGBTQ
more LGBTQ people must be elected to achieve equitable representation**
* According to Williams Institute at UCLA
** There are 519,682 U.S. elected positions, according to Becoming a Candidate, Jennifer L. Lawless.
By The Numbers
As of June 2020, the number of known openly LGBTQ elected officials serving in key positions were:

U.S. Senators (out of 100)
U.S. Representatives (out of 435)

Governors (out of 50)
Statewide Executives (out of 296*)

State Legislators (out of 7,383**)
Mayors

Local Officials (excluding mayors)
Judicial Officials
NOTE: Statewide executives include two territory-wide elected officials in Guam and state legislators include a senator in the U.S. Virgin Islands.
* According to Building Black Political Power, The Collective PAC. Does not include governors.
** According to the National Conference of State Legislators.
Demographics
LGBTQ elected officials continue to become more diverse—with people of color, bisexual and transgender elected officials increasing at a faster pace than LGBTQ white and cisgender elected officials over the past three years. LGBTQ cisgender women in elected office, however, grew at a slower pace than LGBTQ cisgender men. The demographic makeup of LGBTQ elected officials in June 2020 was:
[infogram id=”ofa-raceethnicity-2020-1hdw2jwoqkrd4l0″ prefix=”cYI”]
[infogram id=”ofa-gender-identity-2020-1h8n6mdxqer96xo” prefix=”9oZ”]
[infogram id=”ofa-sexual-orientation-2020-1ho16ve9dx3v2nq” prefix=”jcC”]
[infogram id=”ofa-party-affiliation-2020-1hdw2jwoq5ex4l0″ prefix=”yCa”]
In State Legislatures
State legislatures—the laboratories of democracy—remain both places of opportunity and discrimination for LGBTQ people. Hundreds of anti-LGBTQ bills were introduced in hostile state legislatures in recent years, while progressive state legislatures are leading the way in LGBTQ rights and inclusion. Despite elections in only a few state legislatures in November 2019, the number of openly LGBTQ state legislators increased by 9 percent between June 2019 and June 2020.
openly LGBTQ state legislators nationwide
increase in state legislators from June 2019 - June 2020
more LGBTQ state legislators needed to achieve equitable representation
[infogram id=”ofa-2020-state-leg-map-1hdw2jo0ygpx6l0″ prefix=”PpT”]
State Legislator Demographics
[infogram id=”ofa-state-leg-sexual-orientation-2020-1h7g6k3wye8g2oy” prefix=”DuU”]
[infogram id=”ofa-state-leg-gender-id-2020-1h8n6mdxvex96xo” prefix=”Fs4″]
[infogram id=”ofa-state-legislature-raceethnicity-2020-1h7z2lr3e0oy2ow” prefix=”7nT”]

Out for America Map
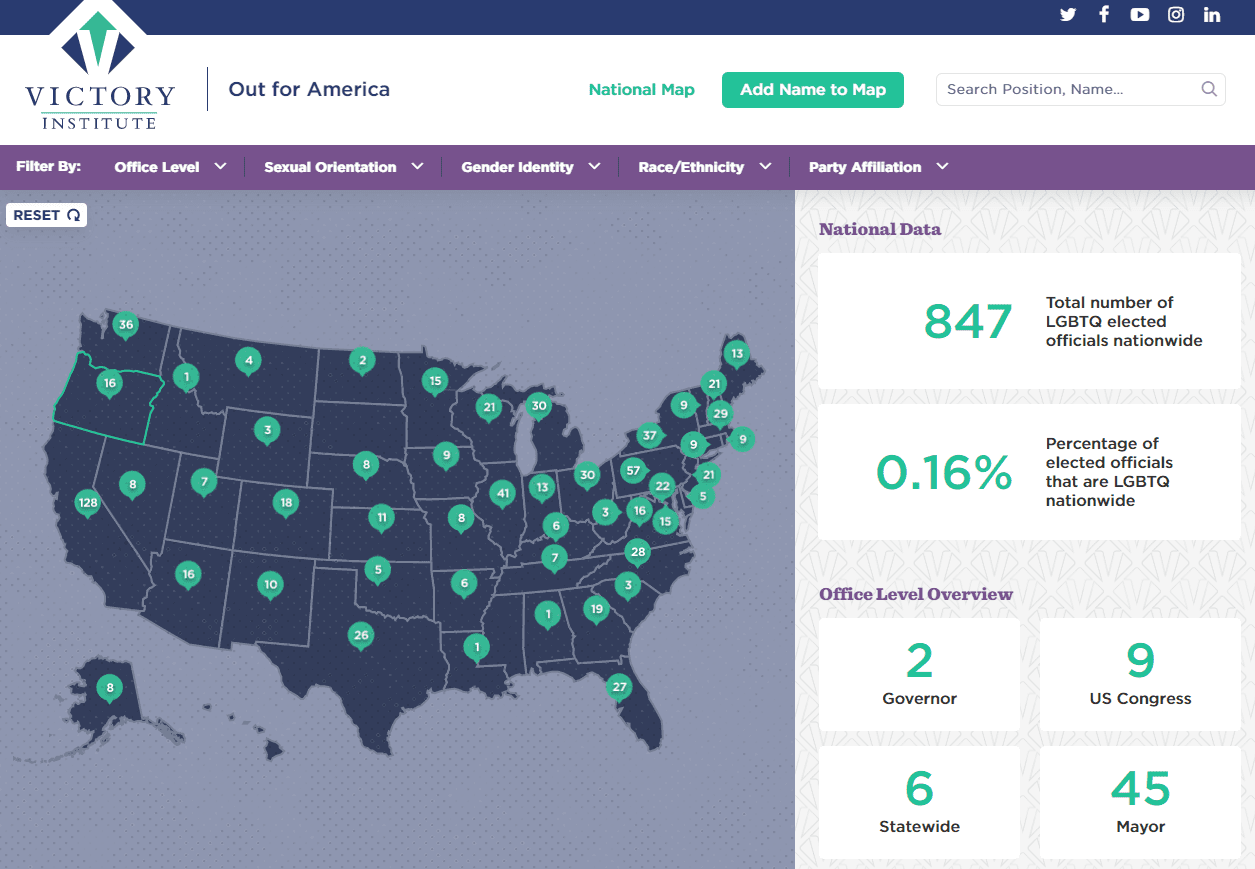
Our Out for America map is the most comprehensive database on known openly LGBTQ elected officials in the United States. The map is updated weekly to show the current state of LGBTQ representation in elected government.
Out for America is LGBTQ Victory Institute’s annual analysis of the state of LGBTQ representation in America. First published in November 2017, the report has since been released annually each June. While the increase in LGBTQ elected officials each year is primarily due to new LGBTQ people being elected, part of the increase can be attributed to people coming out while in office and Victory Institute’s efforts to identify more LGBTQ people already in elected office.
You can view previous Out for America reports below: